


This is part 4 in a series on coaching collaborative teams in professional learning communities. To view all posts, see Coaching in a PLC at Work™.
Although many schools consider themselves professional learning communities, few have collaborative teams that consistently function at high levels. In Amplify Your Impact: Coaching Collaborative Teams in a PLC at Work, we provide a framework for coaching that is built on three cornerstones: clarity, feedback, and support. Once teams are clear on the goals for collaboration and leaders have provided feedback on steps for reaching those goals, we must provide those teams with ongoing support. The Pathways for Coaching Collaborative Teams in a PLC* is a tool created to support teams in their quest to become as effective as possible. Coaches can use the Pathways as they guide teams through collaborative conversations or, when necessary, teams can use the Pathways themselves to self-regulate and reflect upon their actions and discussions during team meetings. We have recently found that some schools are also using the Pathways to collect data on the progress and needs of their collaborative teams.
How can Pathways help us?
Many principals, coaches, and team facilitators have found the Pathways helpful in answering the common question, What do we do next? However, the Pathways can also be used as a formative assessment tool for principals, coaches, and teams to reflect upon team meetings and their responses to the four critical questions of a PLC. When principals, coaches, and other team leaders keep track of the time teams spend in each Pathway, we gain valuable insight about the team’s development and where they might need additional support. In one Michigan school district, teams complete a digital feedback form at the end of each collaborative team meeting, indicating which of the critical questions they responded to and which Pathway(s) they used that day. The data is automatically compiled into a spreadsheet that creates longitudinal graphs, to which principals, coaches, and team leaders have access. To illustrate how the Pathways can be used as a reflection tool, let’s look at the data from two separate teams.
Team A has completed the district’s digital feedback form at the end of each collaborative team meeting since the beginning of the school year, identifying which of the critical questions they were responding to in each meeting. The principal opens up the data spreadsheet that houses this data and sees a pie chart like the one below, which shows the percentage of meetings the team has spent responding to each of the critical questions.
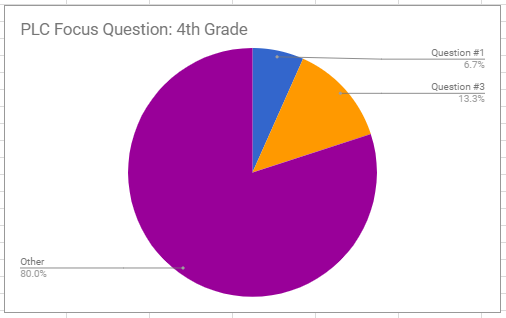
According to this chart, Team A has spent almost 7% of their time in Question 1, no time in Question 2, 13% of their time in Question 3, and 80% of their time in “Other.” It makes sense that less time would be spent on Question 1 since the district has established priority standards and provided relatively detailed instructional units. Teams created the vast majority of their common formative assessments prior to the start of the unit, so it is also understandable that no time has been spent in Question 2. The team has spent 13.3% of their time responding to Question 3, How will we respond when students have not learned?, which is encouraging. However, this team has spent the majority of their meetings in “Other.” As the leader of this school or coach of this team, one might ask, What happens in “Other”? This data illuminates the need to investigate how Team A’s time is truly being spent and how their collaboration is impacting teaching and learning. Sharing this data with Team A can provide an opportunity for candid conversation and the team’s self-reflection on their levels of effectiveness.
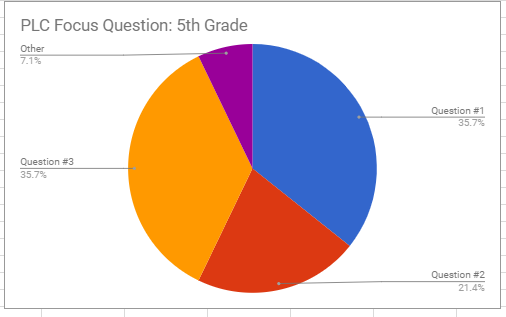
The data from Team B shows a much different picture, as they have a more even distribution among the critical questions with 35.7% of meetings responding to Question 1, 21.4% of meetings responding to Question 2, 35.7% of meetings responding to Question 3, and 7.1% of meetings in “Other.”
In this district, reviewing the data doesn’t stop with the critical questions. The digital feedback forms not only ask teams to indicate which critical question they are responding to but also which Pathways they are following in that particular meeting. Similar to the data on the critical questions, we can uncover important information about teams by reviewing how much time they are spending in each Pathway. Since Team B is spending most of their time in Question 3, let’s place our focus there.
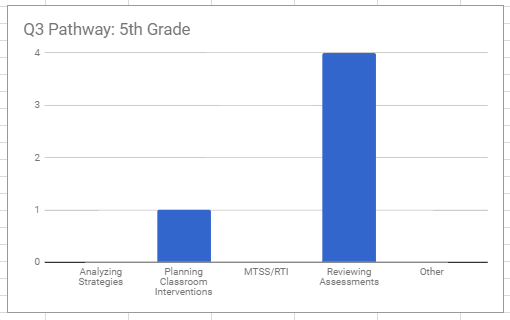
According to the bar graph above, Team B has spent five meetings on Question 3. When we dig into the Pathways, we can see that they have spent four meetings reviewing assessments and one meeting planning classroom interventions. As a principal or coach reviews this data, they most likely would have many questions. For example, if the team spent four meetings reviewing assessments, how many different assessments did they review? How did these reviews impact the assessments? Assuming they reviewed four different assessments, why did they only plan interventions on one occasion? Did the majority of students meet proficiency on the other assessments?
The graph also shows this team has not talked at all about which strategies were successful and which were not. If we want to help teams improve, we must use data to ask the question, Why? Are there cultural issues that prevent this team from discussing which strategies were successful and which were not? Does this team need professional development on best-practice instructional strategies? Knowing that this team does not regularly discuss instructional strategies helps the principal provide the specific support the team needs. In this case, the principal or coach may decide to intentionally design opportunities to talk with Team B about instructional strategies and how the team is spending their meeting time. By sharing this data, the principal can help Team B reflect upon the choices they are making and how those choices are impacting their results.
The Pathways for Coaching Collaborative Teams is a useful tool many districts have used to guide their teams in maintaining a focus on learning during collaborative team meetings. However, we have also found the tool helpful in identifying where teams need additional coaching and support. By asking teams to identify which of the critical questions they are addressing and which Pathway they are following during meetings, we gain valuable insight that can inspire coaching conversations to help us improve teams’ effectiveness. Although there are many collaborative teams that have not yet reached high levels of effectiveness, tools such as the Pathways for Coaching Collaborative Teams can help us move them closer.
*The Pathways for Coaching Collaborative Teams can be found in its entirety in the book Amplify Your Impact: Coaching Collaborative Teams in a PLC at Work™.
[author_bio id=”1510″]